Introduction:
Understanding an industry before attempting to start a successful business in that industry is of paramount importance. Research often proves to be the key factor in determining whether your business is profitable or whether it sinks quicker than Las Ketchup’s music career.
The importance of proper industry research is magnified in the ultra-competitive world of eCommerce, with every man and his dog attempting to build a profitable online business. The following report covers data from the consumer electronics industry in The United Kingdom. The research provides a clear understanding of:
- Top websites
- Traffic share
- Total monthly visits [Avg. Visit Duration; Pages per Visit; Bounce Rate]
- Web technologies used by these sites
All data has been obtained from trusted resources like SimilarWeb and it ranges from 11.16 to 11.16. The idea here is that by understanding what the successful businesses in this industry sector are doing, you can increase your chances of succeeding with a consumer electronics business.
Top 5 Websites
The total number of domains found in this industry is 10,000, and I will analyze only the top 5 websites in terms of traffic share. The information here is based on six months of data between June 2016 and Nov 2016.
Top websites in Consumer Electronics Industry in UK
| Domain | Traffic Share | Avg. Monthly Visits | Desktop Share | Mobile Share | Avg Visit Duration | Pages / Visit | Bounce Rate | AdSense |
|---|---|---|---|---|---|---|---|---|
| currys.co.uk | 15.86% | 33,053,307 | 40.54% | 59.46% | 00:06:19 | 5.73 | 26.44% | |
| sonymobile.com | 5.23% | 10,901,781 | 4.30% | 95.70% | 00:03:14 | 1.51 | 62.96% | |
| carphonewarehouse.com | 4.52% | 9,421,267 | 29.59% | 70.41% | 00:05:47 | 6.56 | 19.10% | |
| pcworld.co.uk | 3.57% | 7,440,097 | 51.47% | 48.53% | 00:05:21 | 5.28 | 24.62% | |
| ebuyer.com | 2.98% | 6,209,849 | 63.85% | 36.15% | 00:04:43 | 4.95 | 35.19% | |
| maplin.co.uk | 2.58% | 5,386,246 | 54.36% | 45.64% | 00:03:50 | 4.77 | 38.20% | |
| webuy.com | 2.52% | 5,252,401 | 38.09% | 61.91% | 00:05:15 | 6.60 | 20.09% | |
| scan.co.uk | 1.65% | 3,444,520 | 69.73% | 30.27% | 00:05:08 | 3.88 | 40.40% | |
| richersounds.com | 1.56% | 3,252,373 | 56.30% | 43.70% | 00:05:59 | 4.97 | 31.35% | |
| pricespy.co.uk | 1.25% | 2,602,458 | 57.61% | 42.39% | 00:03:27 | 3.66 | 37.33% | |
| whathifi.com | 1.22% | 2,549,337 | 65.14% | 34.86% | 00:03:51 | 2.98 | 47.24% | Yes |
| lycamobile.es | 0.99% | 2,063,913 | 0.06% | 99.94% | 00:02:03 | 1.79 | 69.80% | |
| shop.vodafone.co.uk | 0.80% | 1,671,569 | 39.64% | 60.36% | 00:04:54 | 4.67 | 37.13% | |
| wexphotographic.com | 0.72% | 1,506,583 | 57.19% | 42.81% | 00:05:20 | 4.13 | 41.22% | |
| shop.lenovo.com | 0.69% | 1,436,034 | 56.18% | 43.82% | 00:03:56 | 3.06 | 34.52% | |
| jessops.com | 0.66% | 1,374,575 | 61.87% | 38.13% | 00:04:40 | 4.33 | 32.89% | |
| bhphotovideo.com | 0.61% | 1,261,013 | 64.95% | 35.05% | 00:01:56 | 2.02 | 63.82% | |
| shop.bt.com | 0.59% | 1,237,705 | 62.43% | 37.57% | 00:04:04 | 4.14 | 45.98% | |
| samsung.de | 0.58% | 1,212,752 | 0.08% | 99.92% | 00:00:32 | 1.09 | 93.28% | |
| bestbuy.com | 0.54% | 1,126,828 | 53.57% | 46.43% | 00:01:57 | 2.90 | 53.11% | |
| samsungapps.com | 0.53% | 1,104,957 | 0.14% | 99.86% | 00:00:40 | 1.12 | 89.89% | |
| souq.com | 0.50% | 1,049,172 | 8.27% | 91.73% | 00:06:10 | 3.47 | 38.36% | |
| mobilephonesdirect.co.uk | 0.49% | 1,023,321 | 37.75% | 62.25% | 00:05:09 | 4.43 | 32.57% | |
| newegg.com | 0.47% | 969,862 | 66.00% | 34.00% | 00:02:34 | 3.17 | 55.98% | Yes |
| vatanbilgisayar.com | 0.43% | 896,374 | 2.28% | 97.72% | 00:04:02 | 4.50 | 45.16% | |
| mobilefun.co.uk | 0.40% | 839,633 | 47.28% | 52.72% | 00:03:05 | 3.32 | 47.96% | |
| novatech.co.uk | 0.39% | 813,491 | 68.84% | 31.16% | 00:04:09 | 4.07 | 39.61% | |
| dnvod.eu | 0.37% | 779,787 | 60.63% | 39.37% | 00:08:01 | 6.59 | 23.32% | |
| machinemart.co.uk | 0.37% | 773,729 | 50.73% | 49.27% | 00:04:57 | 5.39 | 38.31% | |
| samsung.hu | 0.36% | 758,112 | 0.27% | 99.73% | 00:01:56 | 1.15 | 86.67% | |
| 7dayshop.com | 0.36% | 747,092 | 58.31% | 41.69% | 00:04:17 | 5.05 | 34.31% | |
| cclonline.com | 0.36% | 743,128 | 70.79% | 29.21% | 00:04:25 | 4.18 | 42.87% | |
| dawsons.co.uk | 0.35% | 720,937 | 39.66% | 60.34% | 00:03:27 | 4.05 | 48.90% | |
| bose.co.uk | 0.32% | 674,572 | 58.14% | 41.86% | 00:02:59 | 3.04 | 38.04% | |
| mymemory.co.uk | 0.32% | 662,804 | 74.21% | 25.79% | 00:03:47 | 3.59 | 42.35% | |
| eglobalcentral.co.uk | 0.31% | 652,250 | 55.40% | 44.60% | 00:04:21 | 4.74 | 36.18% | |
| gopro.com | 0.30% | 627,096 | 51.88% | 48.12% | 00:03:48 | 2.99 | 37.71% | |
| secure-mobiles.com | 0.29% | 605,384 | 43.17% | 56.83% | 00:07:16 | 5.15 | 32.46% | |
| qmobile.com.pk | 0.28% | 576,259 | 0.15% | 99.85% | 00:01:01 | 1.43 | 78.00% | |
| aria.co.uk | 0.25% | 526,195 | 73.00% | 27.00% | 00:05:14 | 6.47 | 30.51% | |
| box.co.uk | 0.25% | 525,689 | 53.55% | 46.45% | 00:03:40 | 3.34 | 45.24% | |
| euro.com.pl | 0.24% | 503,115 | 39.61% | 60.39% | 00:04:29 | 4.01 | 38.86% | |
| cdiscount.com | 0.24% | 500,362 | 36.56% | 63.44% | 00:05:28 | 5.23 | 24.35% | Yes |
| coopelectricalshop.co.uk | 0.24% | 490,090 | 65.37% | 34.63% | 00:04:07 | 4.93 | 41.60% | |
| teknosa.com | 0.23% | 485,361 | 2.23% | 97.77% | 00:03:16 | 3.69 | 41.97% | |
| buymobiles.net | 0.23% | 484,997 | 28.82% | 71.18% | 00:05:12 | 4.04 | 39.60% | |
| reviewcentre.com | 0.23% | 482,142 | 52.00% | 48.00% | 00:02:55 | 2.82 | 45.89% | Yes |
| misco.co.uk | 0.23% | 479,750 | 62.46% | 37.54% | 00:03:37 | 3.95 | 45.52% | |
| whatmobile.com.pk | 0.22% | 462,749 | 0.88% | 99.12% | 00:01:37 | 2.47 | 55.73% |
1. Currys.co.uk
Traffic overview
Currys is the number 1 consumer electronics eCommerce website in the UK. Monthly traffic volume is 18.93 million visitors, which is a staggering amount of traffic. To put that figure in context–it is larger than the population of Chile.
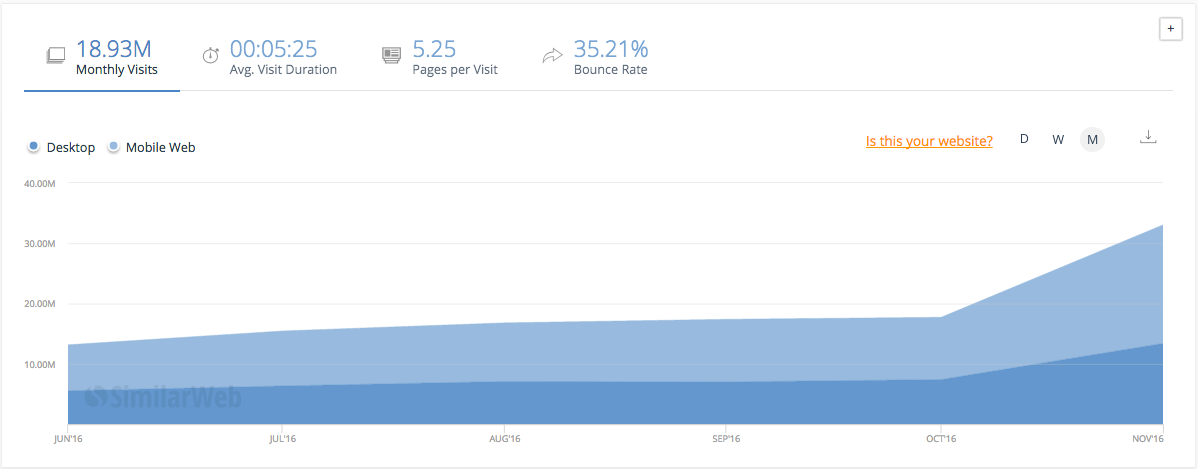
June 2016 – Nov 2016 data
Traffic Source
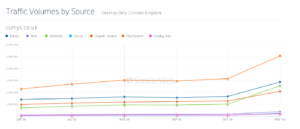
The below screenshot shows that the highest traffic source for Currys is from organic search, suggesting a lot of emphasis on keyword research or brand name recognition.
June 2016 – Nov 2016 data
Search Terms
Top 20 keywords that Currys ranks for are shown below, you may donwload the full list of keywords too:
| Search terms | Organic | Paid | Traffic share | Change | Volume | CPC |
| currys | 99.87% | 0.13% | 39.45% | 57.94% | 3,568,330 | $ 0.13 |
| currys pc world | 98.92% | 1.08% | 3.53% | 32.63% | 336,330 | $ 0.28 |
| currys tv | 35.14% | 64.86% | 1.19% | -6.19% | 146,220 | $ 0.13 |
| currys black friday | 97.49% | 2.51% | 0.87% | 48208.70% | ||
| curry | 99.94% | 0.06% | 0.73% | 136.97% | 3,568,330 | $ 0.13 |
| curries | 100.00% | 0.00% | 0.62% | 37.52% | 3,568,330 | $ 0.13 |
| currys laptops | 44.18% | 55.82% | 0.61% | -44.59% | 64,820 | $ 0.25 |
| pc world currys | 99.87% | 0.13% | 0.61% | 62.69% | 50,190 | $ 0.23 |
| currys pc | 76.31% | 23.69% | 0.41% | 752.61% | 26,330 | $ 0.14 |
| currys uk | 100.00% | 0.00% | 0.40% | 41.47% | 20,180 | $ 0.09 |
| pc world | 99.72% | 0.28% | 0.38% | 25.12% | 1,303,330 | $ 0.24 |
| currys sale | 100.00% | 0.00% | 0.37% | 70.53% | 97,180 | $ 0.26 |
| washing machine | 31.77% | 68.23% | 0.37% | -22.49% | 198,000 | $ 0.90 |
| chromecast | 23.28% | 76.72% | 0.35% | 266.86% | 314,580 | $ 0.20 |
| curry pc world | 100.00% | 0.00% | 0.35% | 60.15% | 336,330 | $ 0.28 |
| laptops | 37.31% | 62.69% | 0.32% | -9.67% | 291,420 | $ 0.70 |
| fridge freezer | 27.68% | 72.32% | 0.31% | -13.74% | 180,000 | $ 0.87 |
| htc vive | 36.26% | 63.74% | 0.31% | 11.82% | 65,000 | $ 0.34 |
| laptop | 23.24% | 76.76% | 0.29% | -32.50% | 291,420 | $ 0.70 |
Popular terms within all the keywords providing traffic from June 2016 to Nov 2016
- Samsung – 1%
- Black – 1%
- Fridge – 1%
- Friday – 0,68
- Washing – 0,59%
- Freezer – 0,56%
- Laptops – 0.51%
- Machine – 0.48%
- Fridge freezer – 0.43%
- inch – 0.40%
- Washing machine – 0.40%
- Sale – 0.35%
- Smart – 0.30%
Audience interests
The top 5 websites that Curry’s visitors tend to browse after leaving the Curry’s website are displayed below.
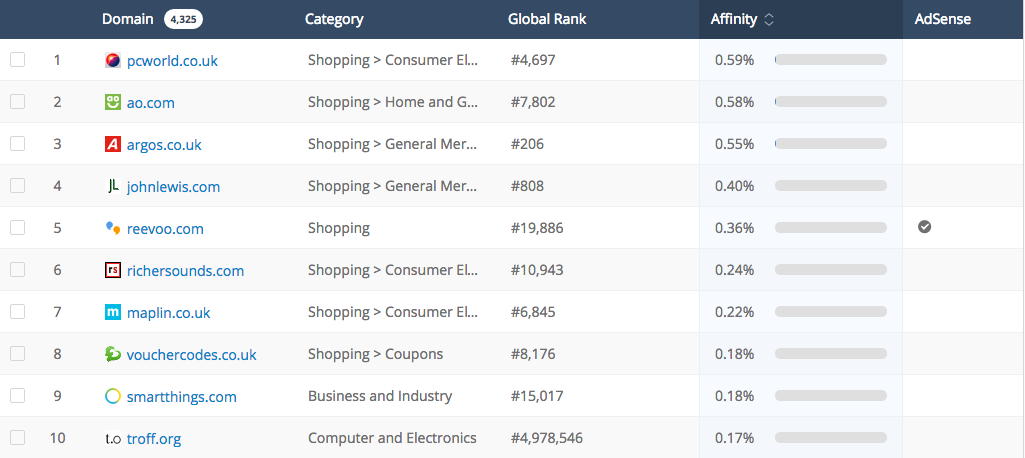
Below you can see current monthly traffic and traffic sources
Technologies Utilized by Currys
For advertisement purposes, Currys use both Google Publisher Tag and RichRelevance. Personalized online advertisements are shown to potential consumers using Criteo, which specifically targets potential customers that have previously visited the Currys website. Currys also uses adRom for targeted email marketing.
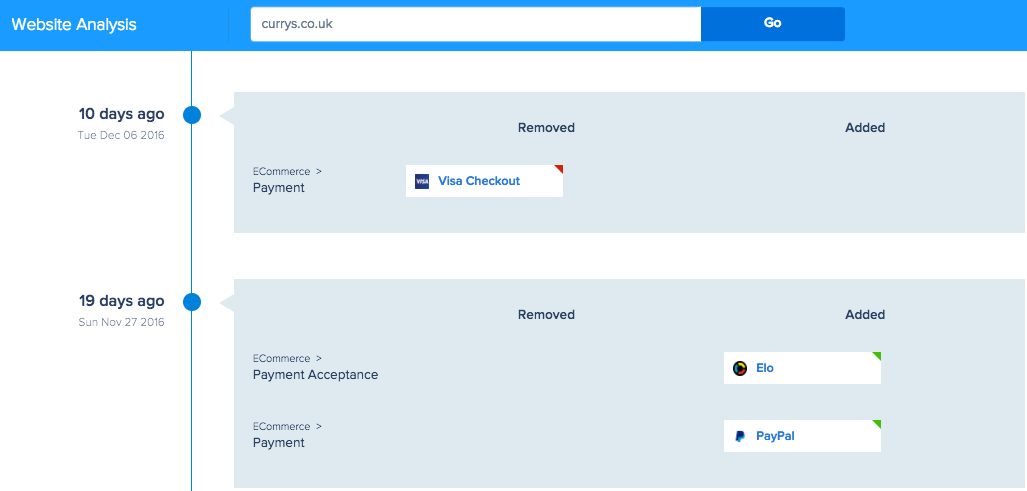
For payment purposes, Currys uses both MasterPass and Paypal systems. Paypal was added recently as a payment system after Currys removed the Visa checkout.

2. Sonymobile.com
This is the official website for Sony’s mobile phone range.
Traffic overview
Monthly traffic is 14.21 million and average visit duration is 2 minutes, which is less than Currys (5 minutes). The bounce rate at Sonymobile is higher than Currys.
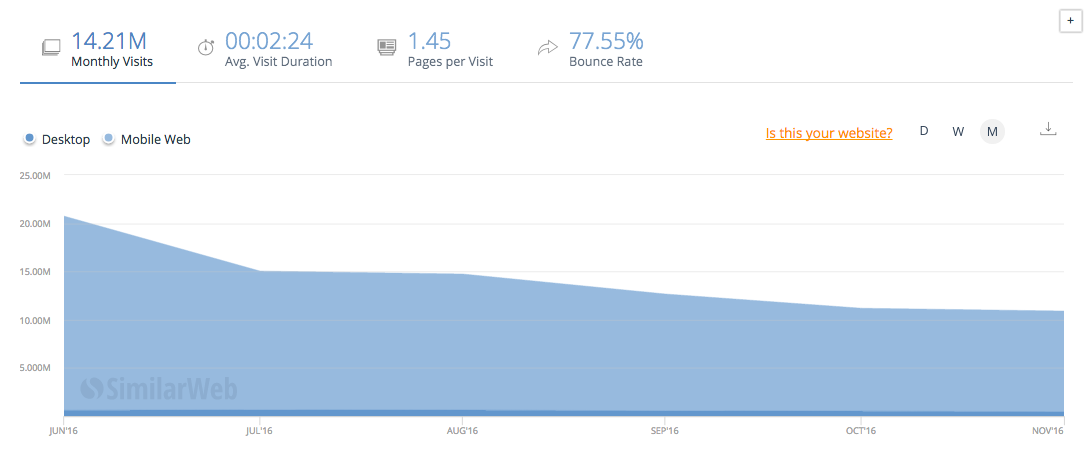
Traffic Source
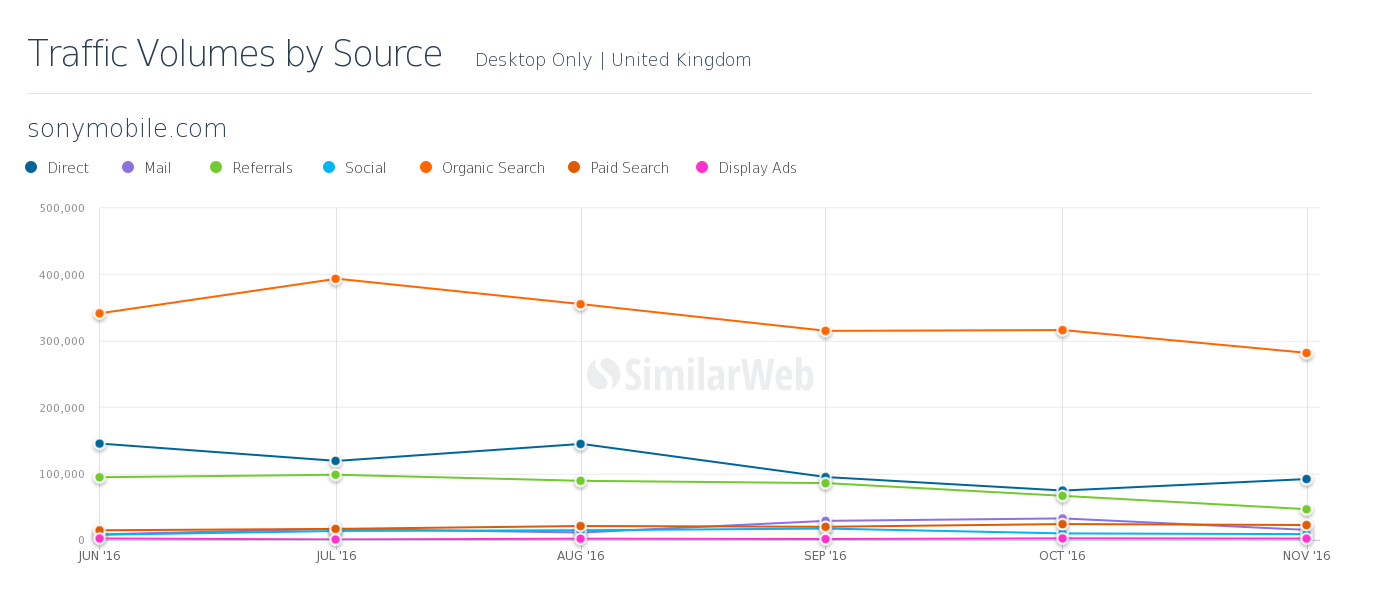
Like Currys, Sonymobile gets the majority of their traffic from organic search.
Search Terms
Since Sony is a multinational company, it’s no major surprise that the keywords Sonymobile ranks highest for nearly all relate to products that Sony sells, especially the popular Xperia range of phones.
| Search terms | Organic | Paid | Traffic share | Change | Volume | CPC |
| sony xperia | 84.64% | 15.36% | 7.58% | -28.83% | 64,330 | $ 0.81 |
| sony pc companion | 100.00% | 0.00% | 3.24% | 3.41% | 4,470 | $ 0.30 |
| sony xperia z5 | 99.58% | 0.42% | 2.72% | 1.69% | 77,380 | $ 0.73 |
| sony xperia x | 100.00% | 0.00% | 2.57% | 37.19% | 20,910 | $ 1.38 |
| xperia x | 100.00% | 0.00% | 1.48% | -39.02% | 10,600 | $ 1.16 |
| xperia xz | 96.34% | 3.66% | 1.31% | -9.28% | 5,560 | $ 1.35 |
| sony phones | 70.14% | 29.86% | 1.29% | 35.80% | 9,670 | $ 1.27 |
| sony xperia xz | 93.46% | 6.54% | 1.25% | 75.53% | 5,680 | $ 1.39 |
| sony xz | 100.00% | 0.00% | 1.15% | -62.08% | 3,380 | $ 1.04 |
| sony xperia xa | 99.68% | 0.32% | 1.14% | 29.54% | 12,920 | $ 1.46 |
| xperia companion | 100.00% | 0.00% | 1.07% | -28.43% | 1,320 | |
| sony xperia z5 compact | 99.64% | 0.36% | 1.03% | -73.41% | 25,970 | $ 0.55 |
| sony smartwatch 3 | 100.00% | 0.00% | 0.91% | 56.26% | 24,720 | $ 0.12 |
| sony xperia z3 | 100.00% | 0.00% | 0.90% | -0.91% | 42,870 | $ 0.58 |
| sony companion | 100.00% | 0.00% | 0.80% | 37.20% | 1,070 | $ 0.34 |
| xperia | 85.00% | 15.00% | 0.71% | -9.90% | 10,080 | $ 0.73 |
| sony xperia z5 premium | 100.00% | 0.00% | 0.65% | -44.95% | 16,260 | $ 0.58 |
| xperia z5 | 99.06% | 0.94% | 0.61% | -30.33% | 21,280 | $ 0.48 |
| sony xperia z3 compact | 99.39% | 0.61% | 0.60% | -62.84% | 14,820 | $ 0.54 |
Popular terms
- sony – 12.09%
- xperia – 10.25%
- sony xperia – 6.66%
- companion – 1.39%
- compact – 1.30%
- sony companion – 0.92%
- xperia compact – 0.88%
- mobile – 0.81%
- sony mobile – 0.69%
- sony xperia compact – 0.61%
- phone – 0.60%
- phones – 0.48%
- android – 0.39%
- screen – 0.38%
- premium – 0.37%
- smartwatch – 0.37%
Audience interest
The top 10 websites visited by people after leaving the Sonymobile website are mostly related to either shopping or technology. One surprising entry on this list is biblicalaudio.com, a website devoted to religious audiobooks.
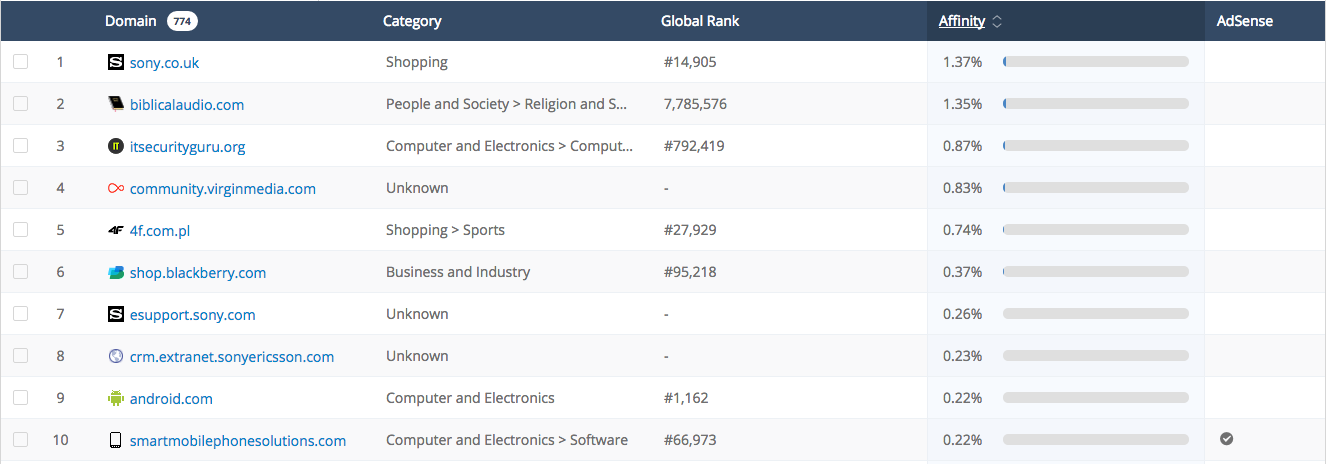
Current traffic and traffic sources
Technologies in use by Sonymobile
In comparison to Currys, Sonymobile uses less advertisment technologies. Currently, they use only Facebook Retargeting and Google AdWords Advertiser for ads. Their content management system is WordPress, showing that even the biggest companies aren’t afraid to build websites using the same technology as the majority of individuals who run much smaller websites.
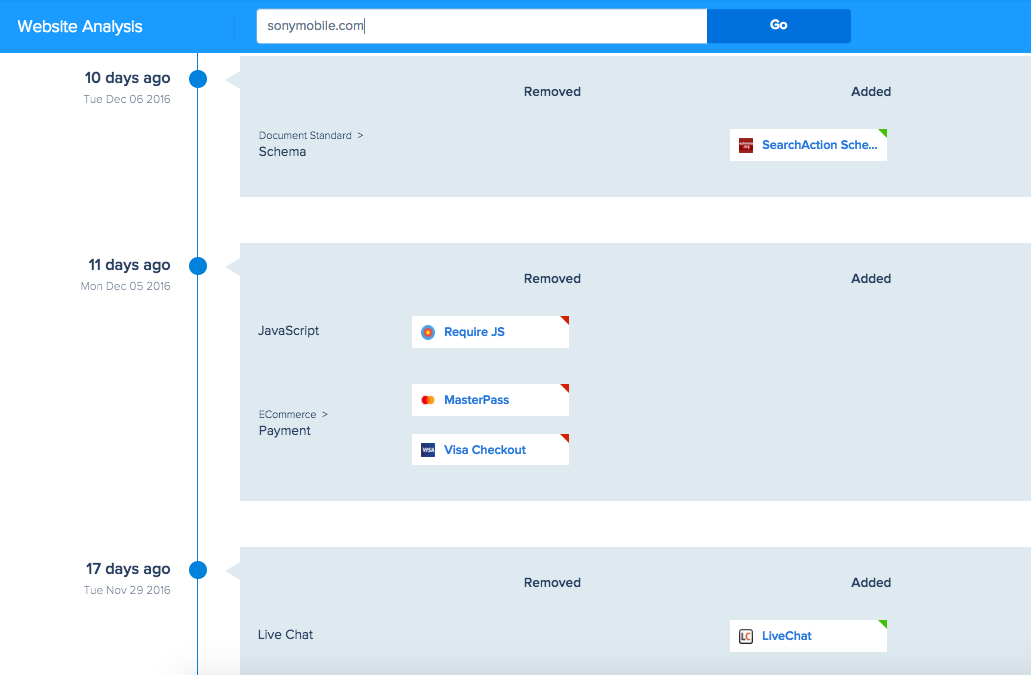
Recently, Sony Mobile has added Search Action Schema and a live chat feature for improved user experience, but they’ve removed Masterpass and Visa checkouts.
3. CarphoneWarehouse.com
Traffic overview
Carphone Warehouse is third on this list for traffic volume but compared to top two, the bounce rate is low. The average visit duration is 5 minutes. Carphone Warehouse seems to attract a specific visitor who wants to browse through a vast collection of phones offered by multiple providers. This targeted marketing could explain the lower bounce rate.
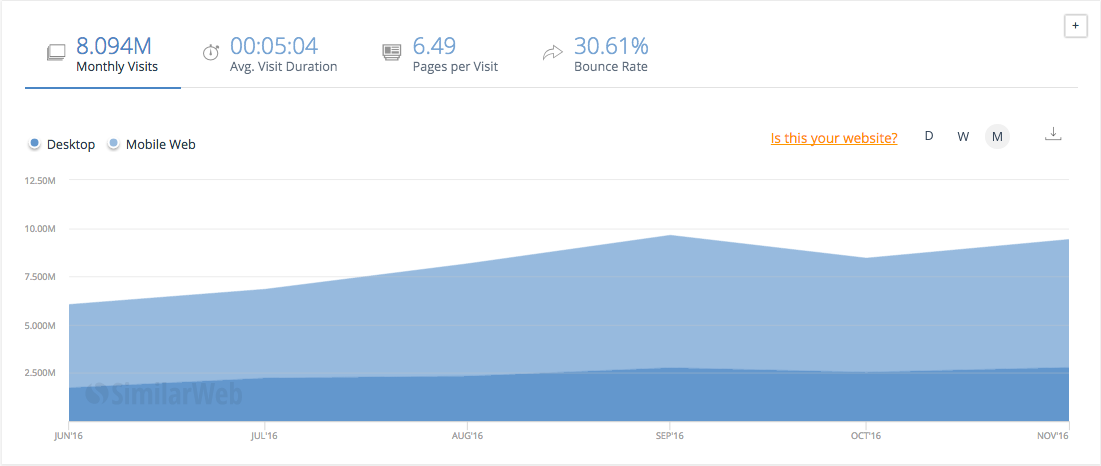
Traffic Source
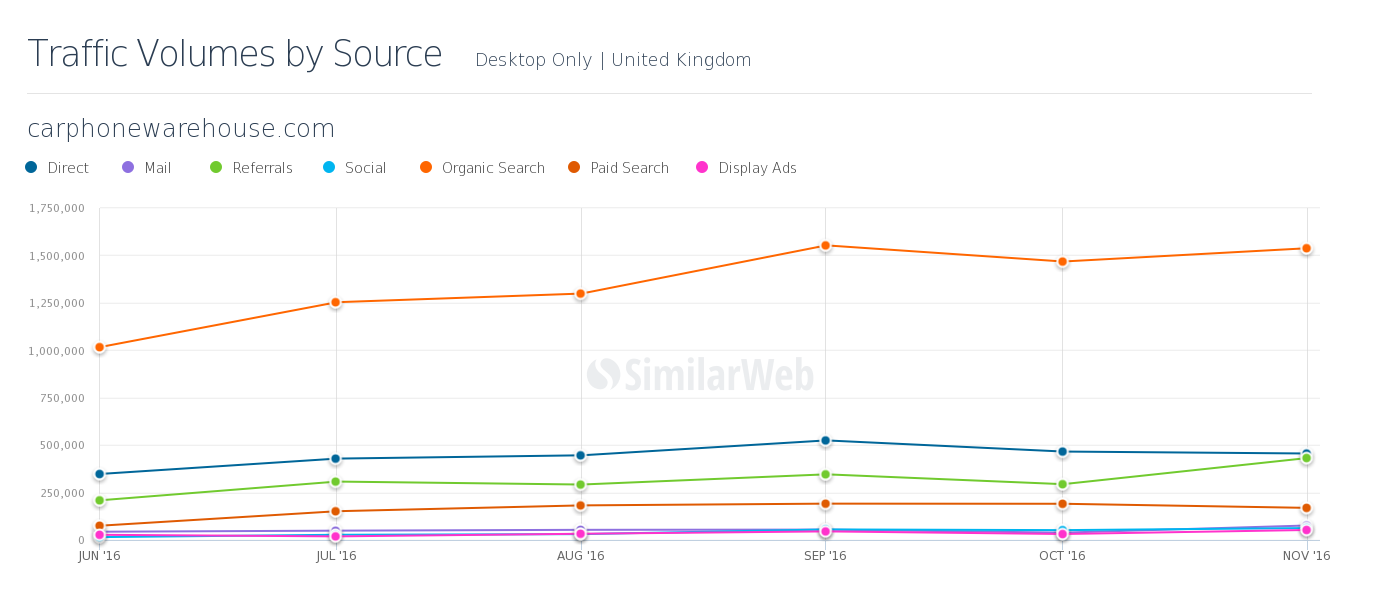
Compared to the top two most popular consumer electronic sites, Carphone Warehouse also has the largest percentage of its traffic arising from organic searches as compared to other sources of traffic. Carphone Warehouse belongs to Dixons Carphone, a company that is actually the parent of two other entries on this list: Currys and PCWorld.
Search Terms
As can be seen from the range of keywords driving traffic to the Carphone Warehouse website, the majority are mobile-related, which is exactly what you’d expect.
| Search terms | Organic | Paid | Traffic share | Change | Volume | CPC |
| carphone warehouse | 99.04% | 0.96% | 49.97% | 5.81% | 1,733,330 | $ 0.22 |
| carphonewarehouse | 99.61% | 0.39% | 1.84% | 4.79% | 1,733,330 | $ 0.22 |
| carphone | 100.00% | 0.00% | 1.45% | 26.33% | 30,830 | $ 0.13 |
| carphone warehouse uk | 99.94% | 0.06% | 1.32% | -16.19% | 26,880 | $ 0.82 |
| google pixel | 57.49% | 42.51% | 1.06% | -33.30% | 61,140 | $ 0.87 |
| carphone warehouse deals | 60.68% | 39.32% | 0.96% | -76.53% | 62,220 | $ 0.39 |
| iphone 7 | 70.28% | 29.72% | 0.89% | -9.74% | 1,226,000 | $ 3.21 |
| iphone 6 | 78.00% | 22.00% | 0.87% | -19.54% | 377,250 | $ 0.68 |
| iphone 6s | 68.26% | 31.74% | 0.81% | 62.75% | 427,750 | $ 1.24 |
| iphone 5s | 85.97% | 14.03% | 0.75% | 26.00% | 331,170 | $ 1.27 |
| iphone se | 58.72% | 41.28% | 0.62% | 95.90% | 365,240 | $ 1.17 |
| samsung galaxy s7 | 75.46% | 24.54% | 0.62% | 81.10% | 273,720 | $ 1.62 |
| samsung galaxy s6 | 72.73% | 27.27% | 0.57% | -34.59% | 247,420 | $ 1.01 |
| samsung galaxy s7 edge | 69.41% | 30.59% | 0.57% | 17.10% | 116,870 | $ 1.56 |
| carphone warehouse iphone | 69.89% | 30.11% | 0.57% | 0.00% | 13,080 | $ 0.46 |
| carphone warehouse phones | 57.33% | 42.67% | 0.55% | 0.00% | ||
| cpw | 100.00% | 0.00% | 0.51% | -33.91% | 12,320 | $ 0.20 |
| carphone warehouse black friday | 95.66% | 4.34% | 0.49% | 0.00% | ||
| mobile phones | 83.46% | 16.54% | 0.48% | 83.91% | 128,750 | $ 4.16 |
Popular terms
Popular terms used in all keywords which drove traffic from June 2016 to Nov 2016.
- iphone – 2.88%
- samsung – 1.91%
- galaxy – 1.42%
- phone – 1.22%
- samsung galaxy – 1.11%
- phones – 1.06%
- pixel – 0.81%
- mobile – 0.81%
- sim – 0.77%
- edge – 0.63%
- Google – 0.59%
- google pixel – 0.53%
- nexus – 0.40%
Audience interests
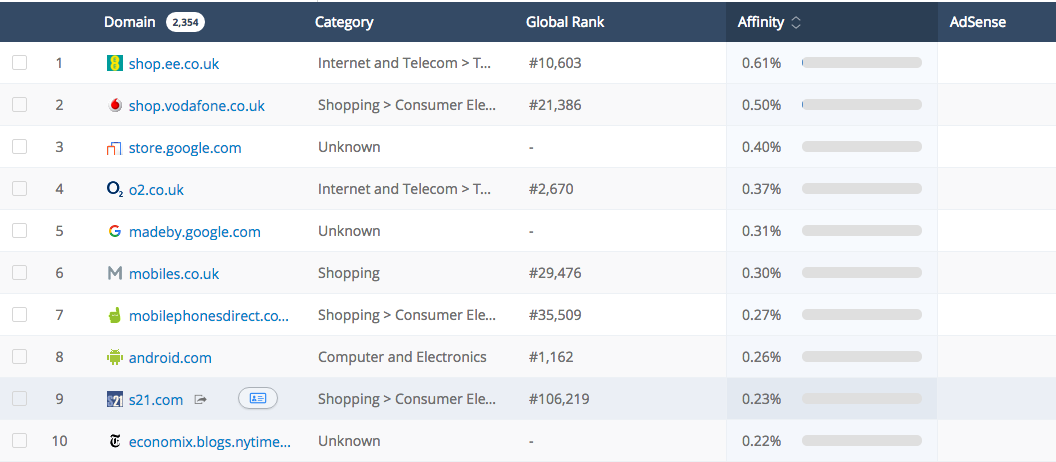
The below screenshot shows a list of websites that carphonewarehouse.com website visitors navigate to after leaving the CarephoneWarehouse. Those among you with a keen eye will note that a couple of the UK’s leading mobile phone providers feature on this list, meaning that customers are likely comparing the price of a phone with Carphone Warehouse versus the price that service providers themselves charge.
Current traffic and traffic sources
Technologies in use by Carphone Warehouse.com
For advertisement purposes, Carphone Warehouse uses AppNexus, which is the most advanced platform for buying real-time online advertising. AppNexus’s clients include the largest ad networks and online advertisers. In November 2016, AppNexus was removed from the site.
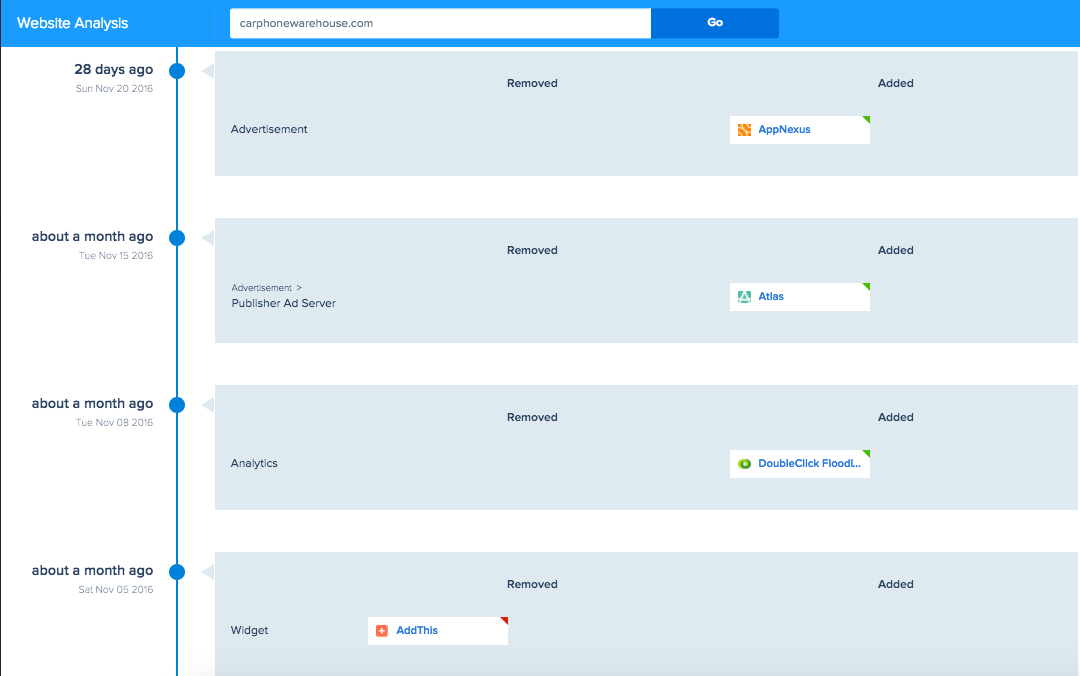
- Criteo Advertiser and Google AdWords are also used. For retargeting, Carphone uses Criteo, and they also added the popular ad server Atlas in November 2016.
- For the ecommerce payment systems – American Express, Visa, and Mastercard secure checkouts are used.
- For analytics purposes, Carphone Warehouse surprisingly doesn’t use Google Analytics. For this task, they opt for a combination of Omniture and a form of HTML tag known as DoubleClick Floodlights.
- For monitoring customer experience, they use SessionCam, which is possibly another driving force behind their low bounce rates and high average visit duration.
4. PCworld.co.uk
PCWorld is number 4th in terms of traffic, which is impressive since Currys and PCWorld are basically a dual-branded company. Both are hosted in the same IP: Currys DNS and PCWorld DNS. The only slight difference between them is the items being sold.


Traffic overview
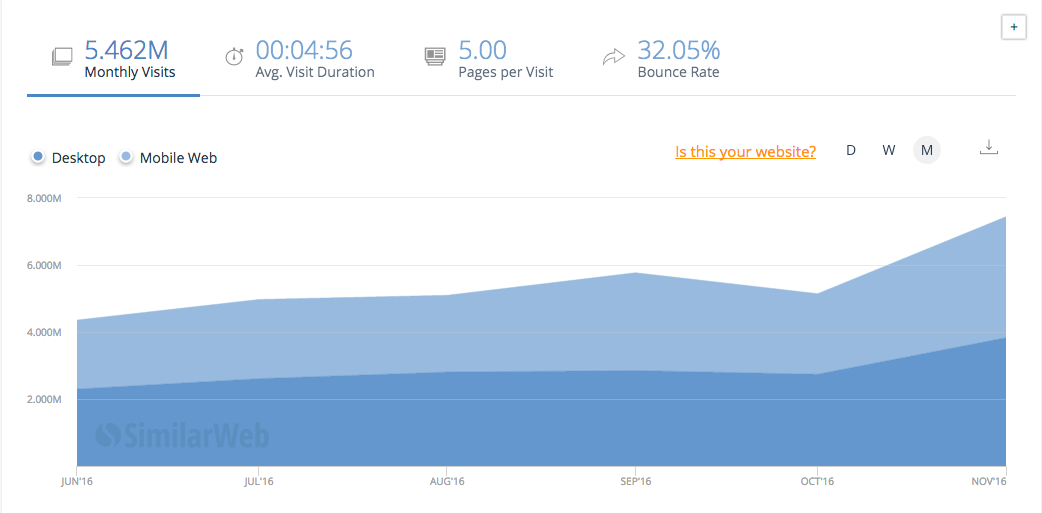
Monthly traffic is 5.46 million visits, with a 32% bounce rate and average session duration of 4 minutes.
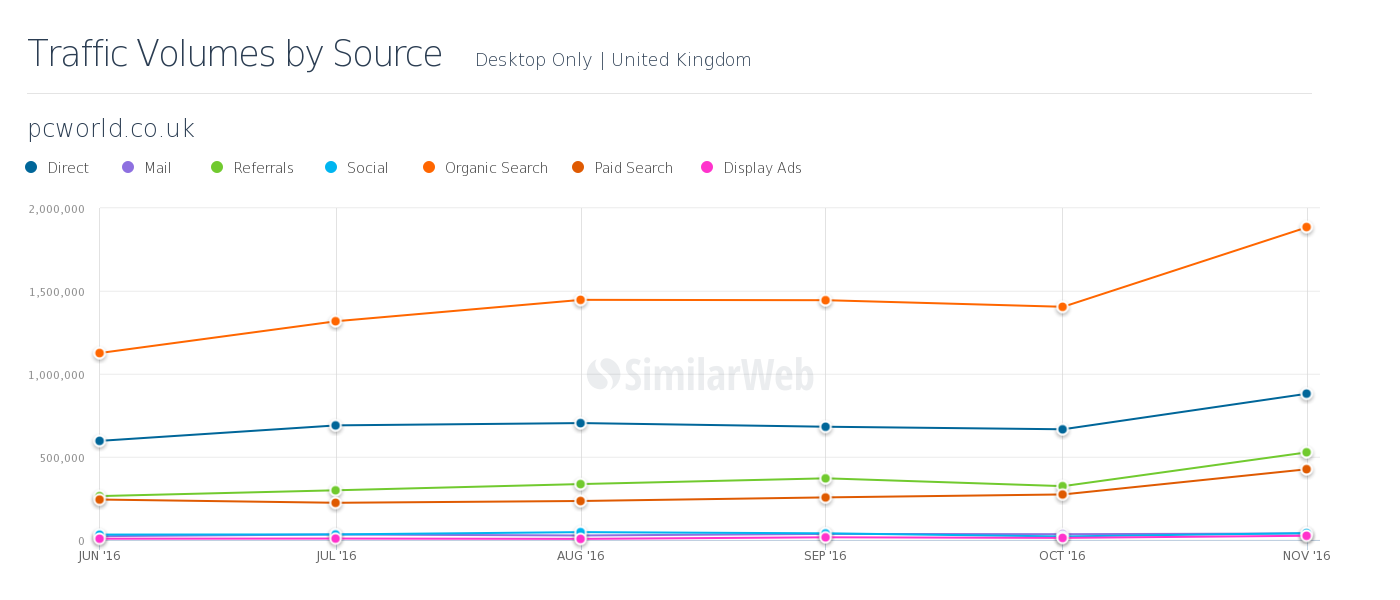
Traffic Source
The trend from the top three most popular consumer electronics sites continues in PCWorld’s case, with the highest traffic source also being organic search.
Search Terms
We can see that the keywords driving traffic to PCWorld are generic and have lots of monthly searches, compared to, for example, Sonymobile, a site that ranks highly for terms specific to the exact products it sells (Xperia).
Driving traffic to PCWorld are keywords such as “laptops” with 291,420 searches monthly or “macbook pro” with 129,790 searches, and more keywords [see the table below or download the whole list of keywords]
| Search terms | Organic | Paid | Traffic share | Change | Volume | CPC |
| laptops | 99.84% | 0.16% | 0.69% | 5.86% | 291,420 | $ 0.70 |
| laptop | 99.62% | 0.38% | 0.56% | 2.49% | 291,420 | $ 0.70 |
| htc vive | 14.36% | 85.64% | 0.44% | 166.82% | 65,000 | $ 0.34 |
| gaming laptops | 46.96% | 53.04% | 0.41% | -37.29% | 45,920 | $ 1.14 |
| dell xps 13 | 0.33% | 99.67% | 0.39% | -2.94% | 46,590 | $ 0.65 |
| surface pro 4 | 1.63% | 98.37% | 0.35% | 216.18% | 91,790 | $ 0.69 |
| laptop deals | 5.28% | 94.72% | 0.33% | 26.33% | 68,750 | $ 0.69 |
| external hard drive | 100.00% | 0.00% | 0.26% | 11.70% | 47,000 | $ 0.30 |
| currys pc | 7.24% | 92.76% | 0.23% | 0.00% | 26,330 | $ 0.14 |
| pc | 77.00% | 23.00% | 0.22% | -21.43% | ||
| chromebook | 55.35% | 44.65% | 0.21% | 43.09% | 51,670 | $ 0.36 |
| pc word | 100.00% | 0.00% | 0.21% | -1.11% | 3,680 | $ 0.28 |
| monitor | 87.97% | 12.03% | 0.20% | 9.62% | 43,930 | $ 0.44 |
| currys | 100.00% | 0.00% | 0.19% | 57.85% | 3,568,330 | $ 0.13 |
| desktop pc | 69.95% | 30.05% | 0.19% | 45.19% | 17,090 | $ 0.58 |
| cheap laptops | 74.10% | 25.90% | 0.18% | -1.29% | 46,580 | $ 0.60 |
| 4k monitor | 0.00% | 100.00% | 0.18% | -23.21% | 16,130 | $ 0.57 |
| asus zenbook ux305 | 4.35% | 95.65% | 0.17% | -28.95% | 22,780 | $ 0.48 |
| asus zenbook | 18.11% | 81.89% | 0.17% | 36.70% | 16,410 | $ 0.48 |
Popular terms
Popular terms used in all keywords which drove traffic from June 2016 to Nov 2016.
- pcworld – 6.56%
- laptop – 2.13%
- laptops – 2.12%
- gaming – 1.01%
- asus – 0.85%
- currys – 0.84%
- surface – 0.67%
- monitor – 0.64%
- world laptops – 0.63%
- lenovo – 0.61%
- drive – 0.61%
- hard – 0.53%
- dell – 0.50%
- hard drive – 0.47%
- macbook – 0.45%
- tablet – 0.43%
- printer – 0.43%
- surface pro – 0.43%
- deals – 0.41%
- acer – 0.41%
- desktop – 0.40%
- samsung – 0.39%
- chromebook – 0.39%
- wireless – 0.37%
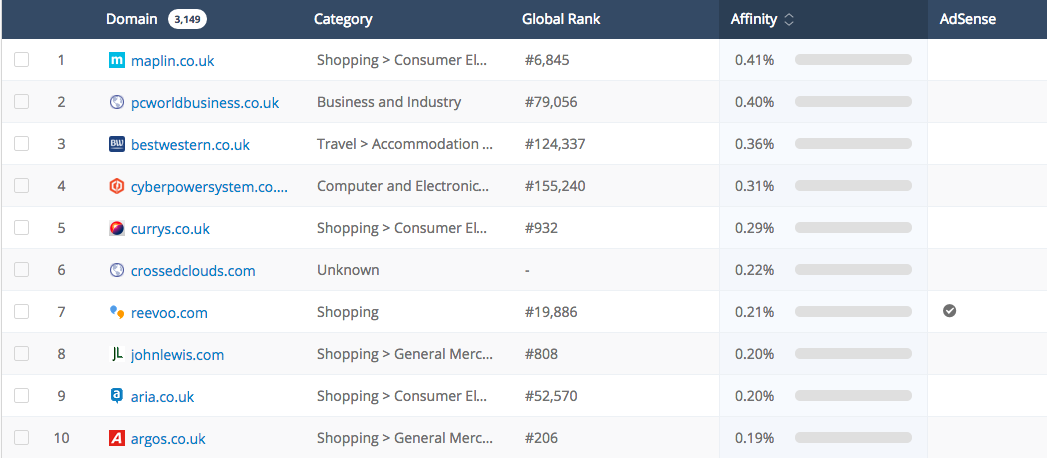
Audience interests
The below screenshot shows which websites pcworld website visitors enter after leaving the PCWorld site. There seems to be a lot of similar retailers, suggesting that customers are shopping around to find the best deals.
Current traffic and traffic sources
Technologies in use by PCworld
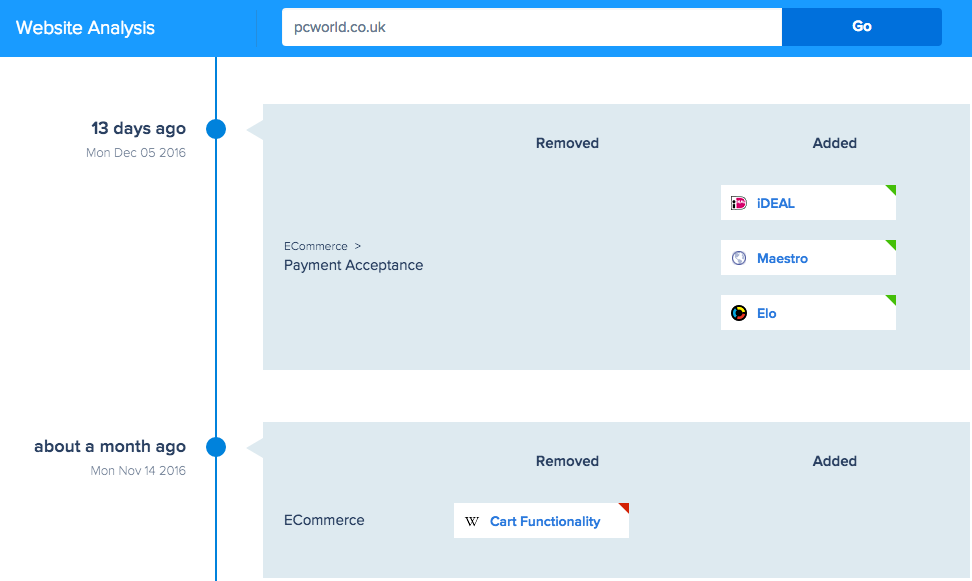
Since Currys and PCWorld build their websites on the same platform, the web technologies utilized are nearly identical. The only real difference is in the available ecommerce payment methods. As was previously mentioned, Currys have removed Visa checkout and added PayPal. Paypal was already in use on the PCWorld site before its introduction to Currys.
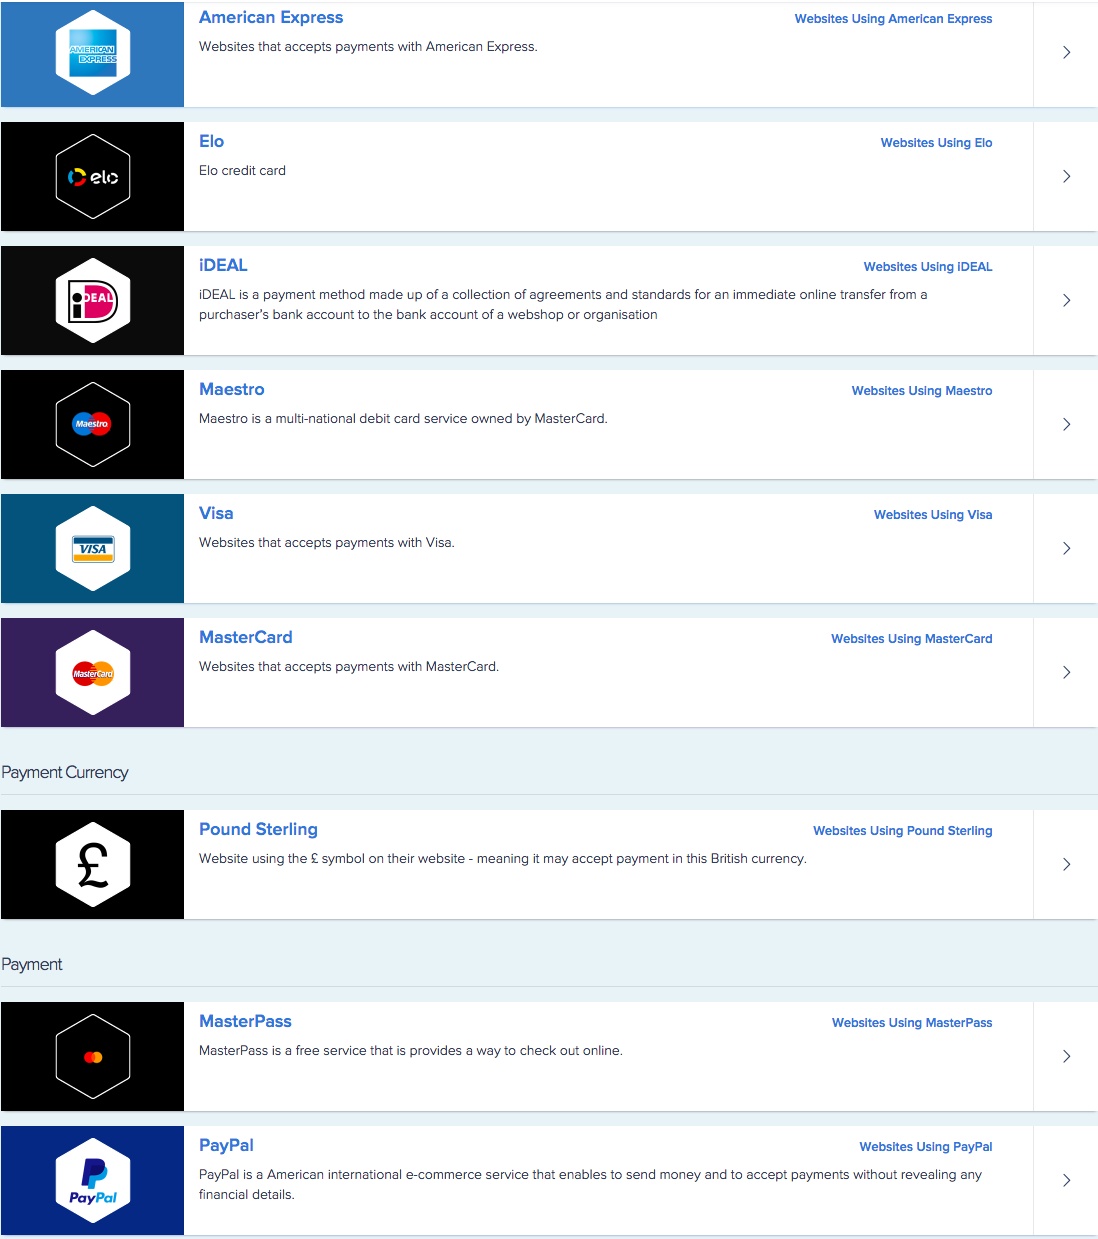
For analytics purposes, PCworld uses Omniture (on Jun 13 2016). Google Analytics was removed in October 2016. Additional check here
5. Ebuyer.com
Traffic overview
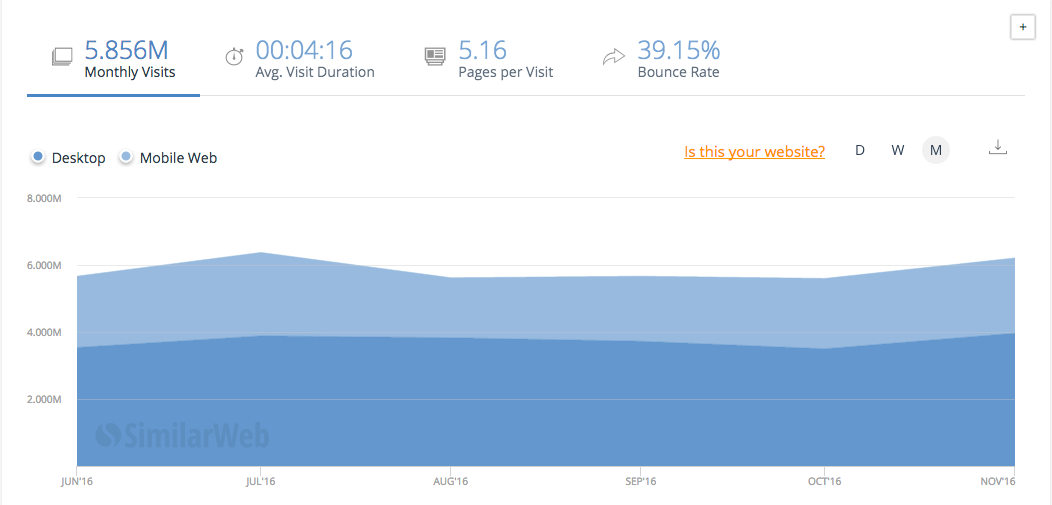
Monthly traffic for ebuyer.com is 5.856 million visits, with a bounce rate of 39%.
Traffic Source
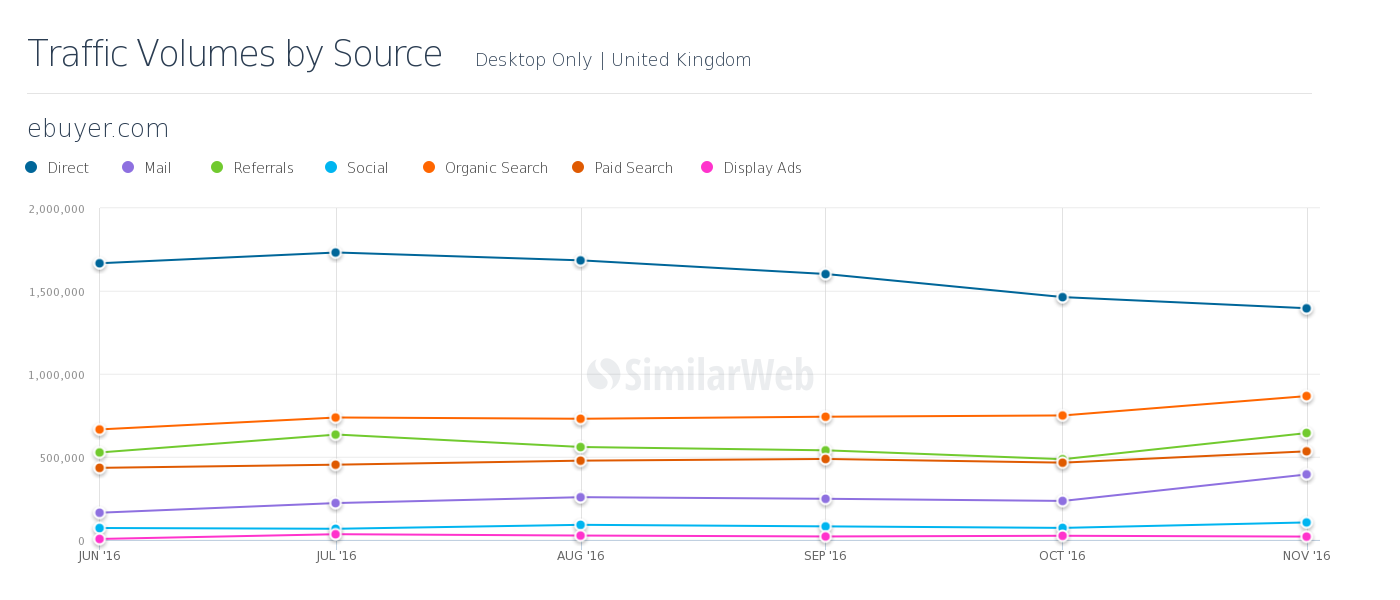
There is a difference here for ebuyer.com compared to the previous four websites. The best traffic source for ebuyer is direct traffic, which provided 43% of traffic in 6 months, whereas organic traffic provided just only 20%.
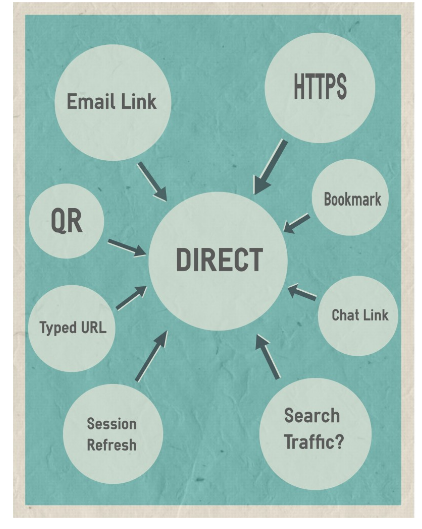
Direct traffic sounds like quite a straightforward term, but it’s actually quite complex. Take a look below at what factors actually contribute to “direct traffic.” You’ll soon get dizzy!
Search Terms
Compared to the aforementioned websites on this list, organic traffic is low for ebuyer.com, which means this site is not ranking for many competitive keywords. The majority of ranking keywords are related to computer components such as graphics cards and storage.
| Search terms | Organic | Paid | Traffic share | Change | Volume | CPC |
| gtx 1070 | 17.77% | 82.23% | 1.55% | 118.95% | 34,210 | $ 0.25 |
| rx 480 | 20.65% | 79.35% | 1.21% | -83.40% | 21,160 | $ 0.37 |
| gtx 1080 | 13.37% | 86.63% | 0.88% | -10.90% | 46,360 | $ 0.39 |
| gtx 1060 | 23.48% | 76.52% | 0.74% | 34.52% | 20,210 | $ 0.46 |
| ssd | 69.61% | 30.39% | 0.63% | 37.41% | 34,680 | $ 0.73 |
| ebayer | 68.99% | 31.01% | 0.55% | 49.94% | 2,580 | $ 0.24 |
| e buyer | 86.37% | 13.63% | 0.39% | 0.95% | 3,890 | $ 0.08 |
| 4k monitor | 23.76% | 76.24% | 0.35% | -85.15% | 16,130 | $ 0.57 |
| laptops | 87.03% | 12.97% | 0.29% | 30.15% | 291,420 | $ 0.70 |
| 1tb ssd | 67.38% | 32.62% | 0.27% | 118.33% | 8,700 | $ 0.82 |
| rx480 | 9.92% | 90.08% | 0.27% | -10.90% | 5,660 | $ 0.53 |
| gaming pc | 100.00% | 0.00% | 0.24% | 36.95% | 77,750 | $ 1.06 |
| gaming laptops | 53.79% | 46.21% | 0.22% | -1.34% | 45,920 | $ 1.14 |
| ssd drive | 64.24% | 35.76% | 0.20% | -62.54% | 8,650 | $ 0.56 |
| ebyer | 71.65% | 28.35% | 0.19% | -64.41% | 1,470 | $ 0.13 |
| m.2 ssd | 61.78% | 38.22% | 0.18% | 249.12% | 3,800 | $ 0.58 |
| 144hz monitor | 8.21% | 91.79% | 0.17% | 57.65% | 5,730 | $ 0.48 |
| 500gb ssd | 68.62% | 31.38% | 0.17% | -26.75% | 4,530 | $ 0.49 |
| monitor | 29.60% | 70.40% | 0.17% | 286.12% | 43,930 | $ 0.44 |
Popular terms
Popular terms used in all keywords which drove traffic from June 2016 to Nov 2016.
- ebuyer – 12.73%
- gtx – 1.76%
- monitor – 1.17%
- ssd – 1.03%
- gaming – 0.79%
- 1070 – 0.77%
- drive – 0.76%
- laptop – 0.67%
- gtx 1070 – 0.63%
- 480 – 0.60%
- hard – 0.56%
- 1080 – 0.53%
- asus – 0.51%
- hard drive – 0.50%
- cheap – 0.49%
- laptops – 0.44%
- gtx 1080 – 0.44%
- 1060 – 0.39%
- inch – 0.35%
- gtx 1060 – 0.35%
Audience interests
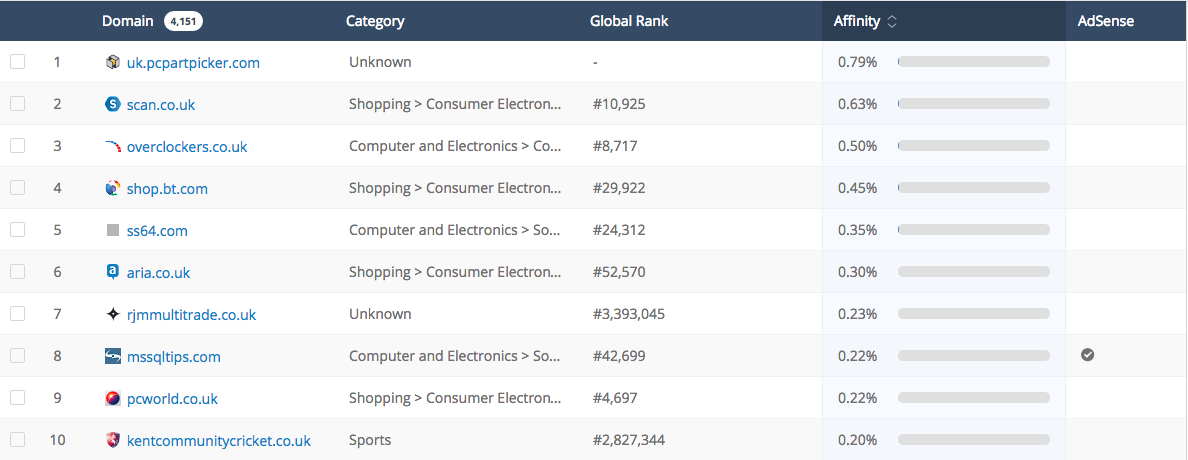
The below screenshot shows which websites ebuyer website visitors enter after exiting this site
Technologies in use by ebuyer.com
Ebuyer limits its advertisement technologies to Facebook Retargeting and Google AdWords Advertiser. Ebuyer is the only website in this list to pass Google’s trusted stores check.

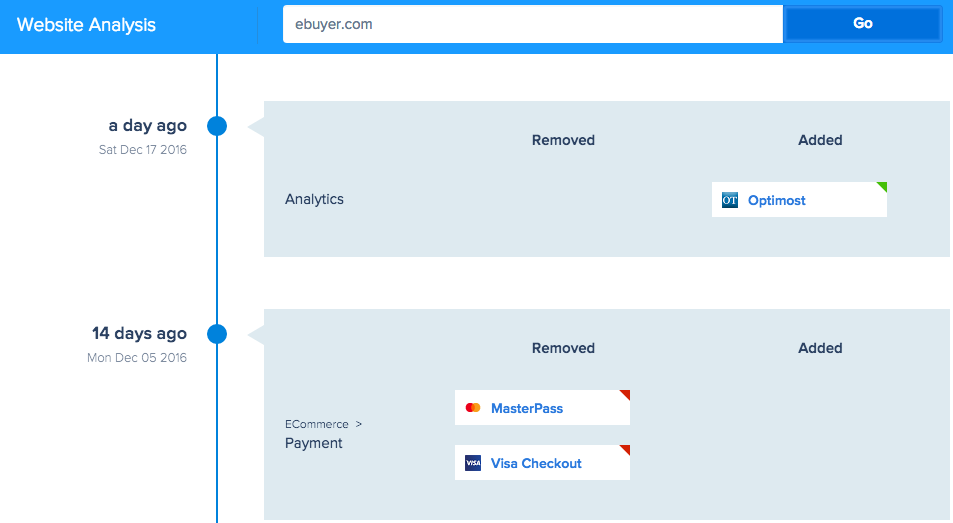
Regarding changes to the payment side, ebuyer removed both Masterpass and Visa checkouts this year. They started using and A/B testing tool Aptimost (Dec 17 2016), which signifies a move towards experimenting with their conversion methods.
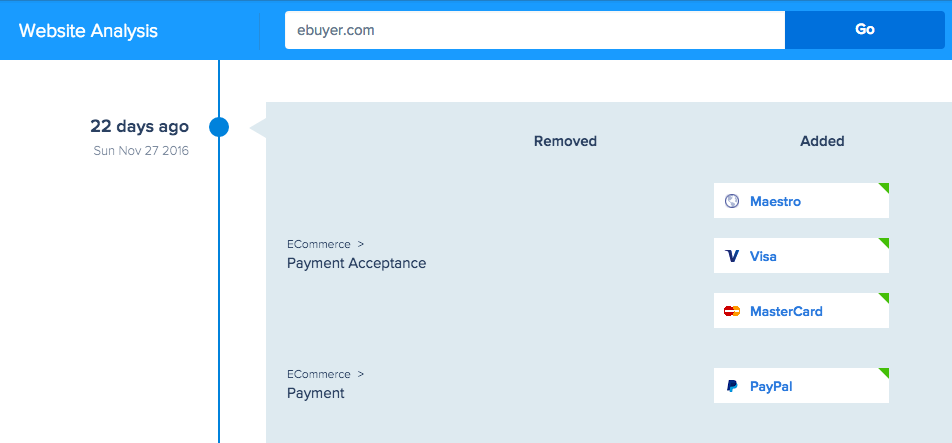
Ebuyer has added new payment methods, including Maestro, Visa, MasterCard, and Paypal.
From the above data, there are 4 key lessons that stand out about the current state of the consumer electronics industry:
- Organic search is crucial. Four of the top five websites in this industry rank highest thanks to organic search. The lesson is clear: emphasis on keywords is important.
- Customers will shop around. A look at the audience interests tab for any of the top five websites shows visitors leaving for other websites in that industry. Consumer electronic goods tend to be pricier, meaning that customers will always shop around for the best deal.
- Google analytics is not a panacea. It’s interesting to note that despite the fact nearly every SEO or eCommerce website will advise you to use Google Analytics, some of the top websites in this industry use alternative analytics tools like Omniture. Although it’s worth bearing in mind that this could be a specific strategy implemented by Dixons Carphone, parent company of both Carphone Warehouse & PCWorld.
- Visa checkout is…out. There is a clear trend showing some of the top consumer electronics websites abandoning the use of a Visa checkout. Perhaps there are accessibility issues or the platform just isn’t used enough. Either way, retailers in this industry seem dissatisfied with it.
Thanks for this awesome analysis. Just downloaded few lists 😉
You are welcome 🙂